COMSPOC Video Galleries
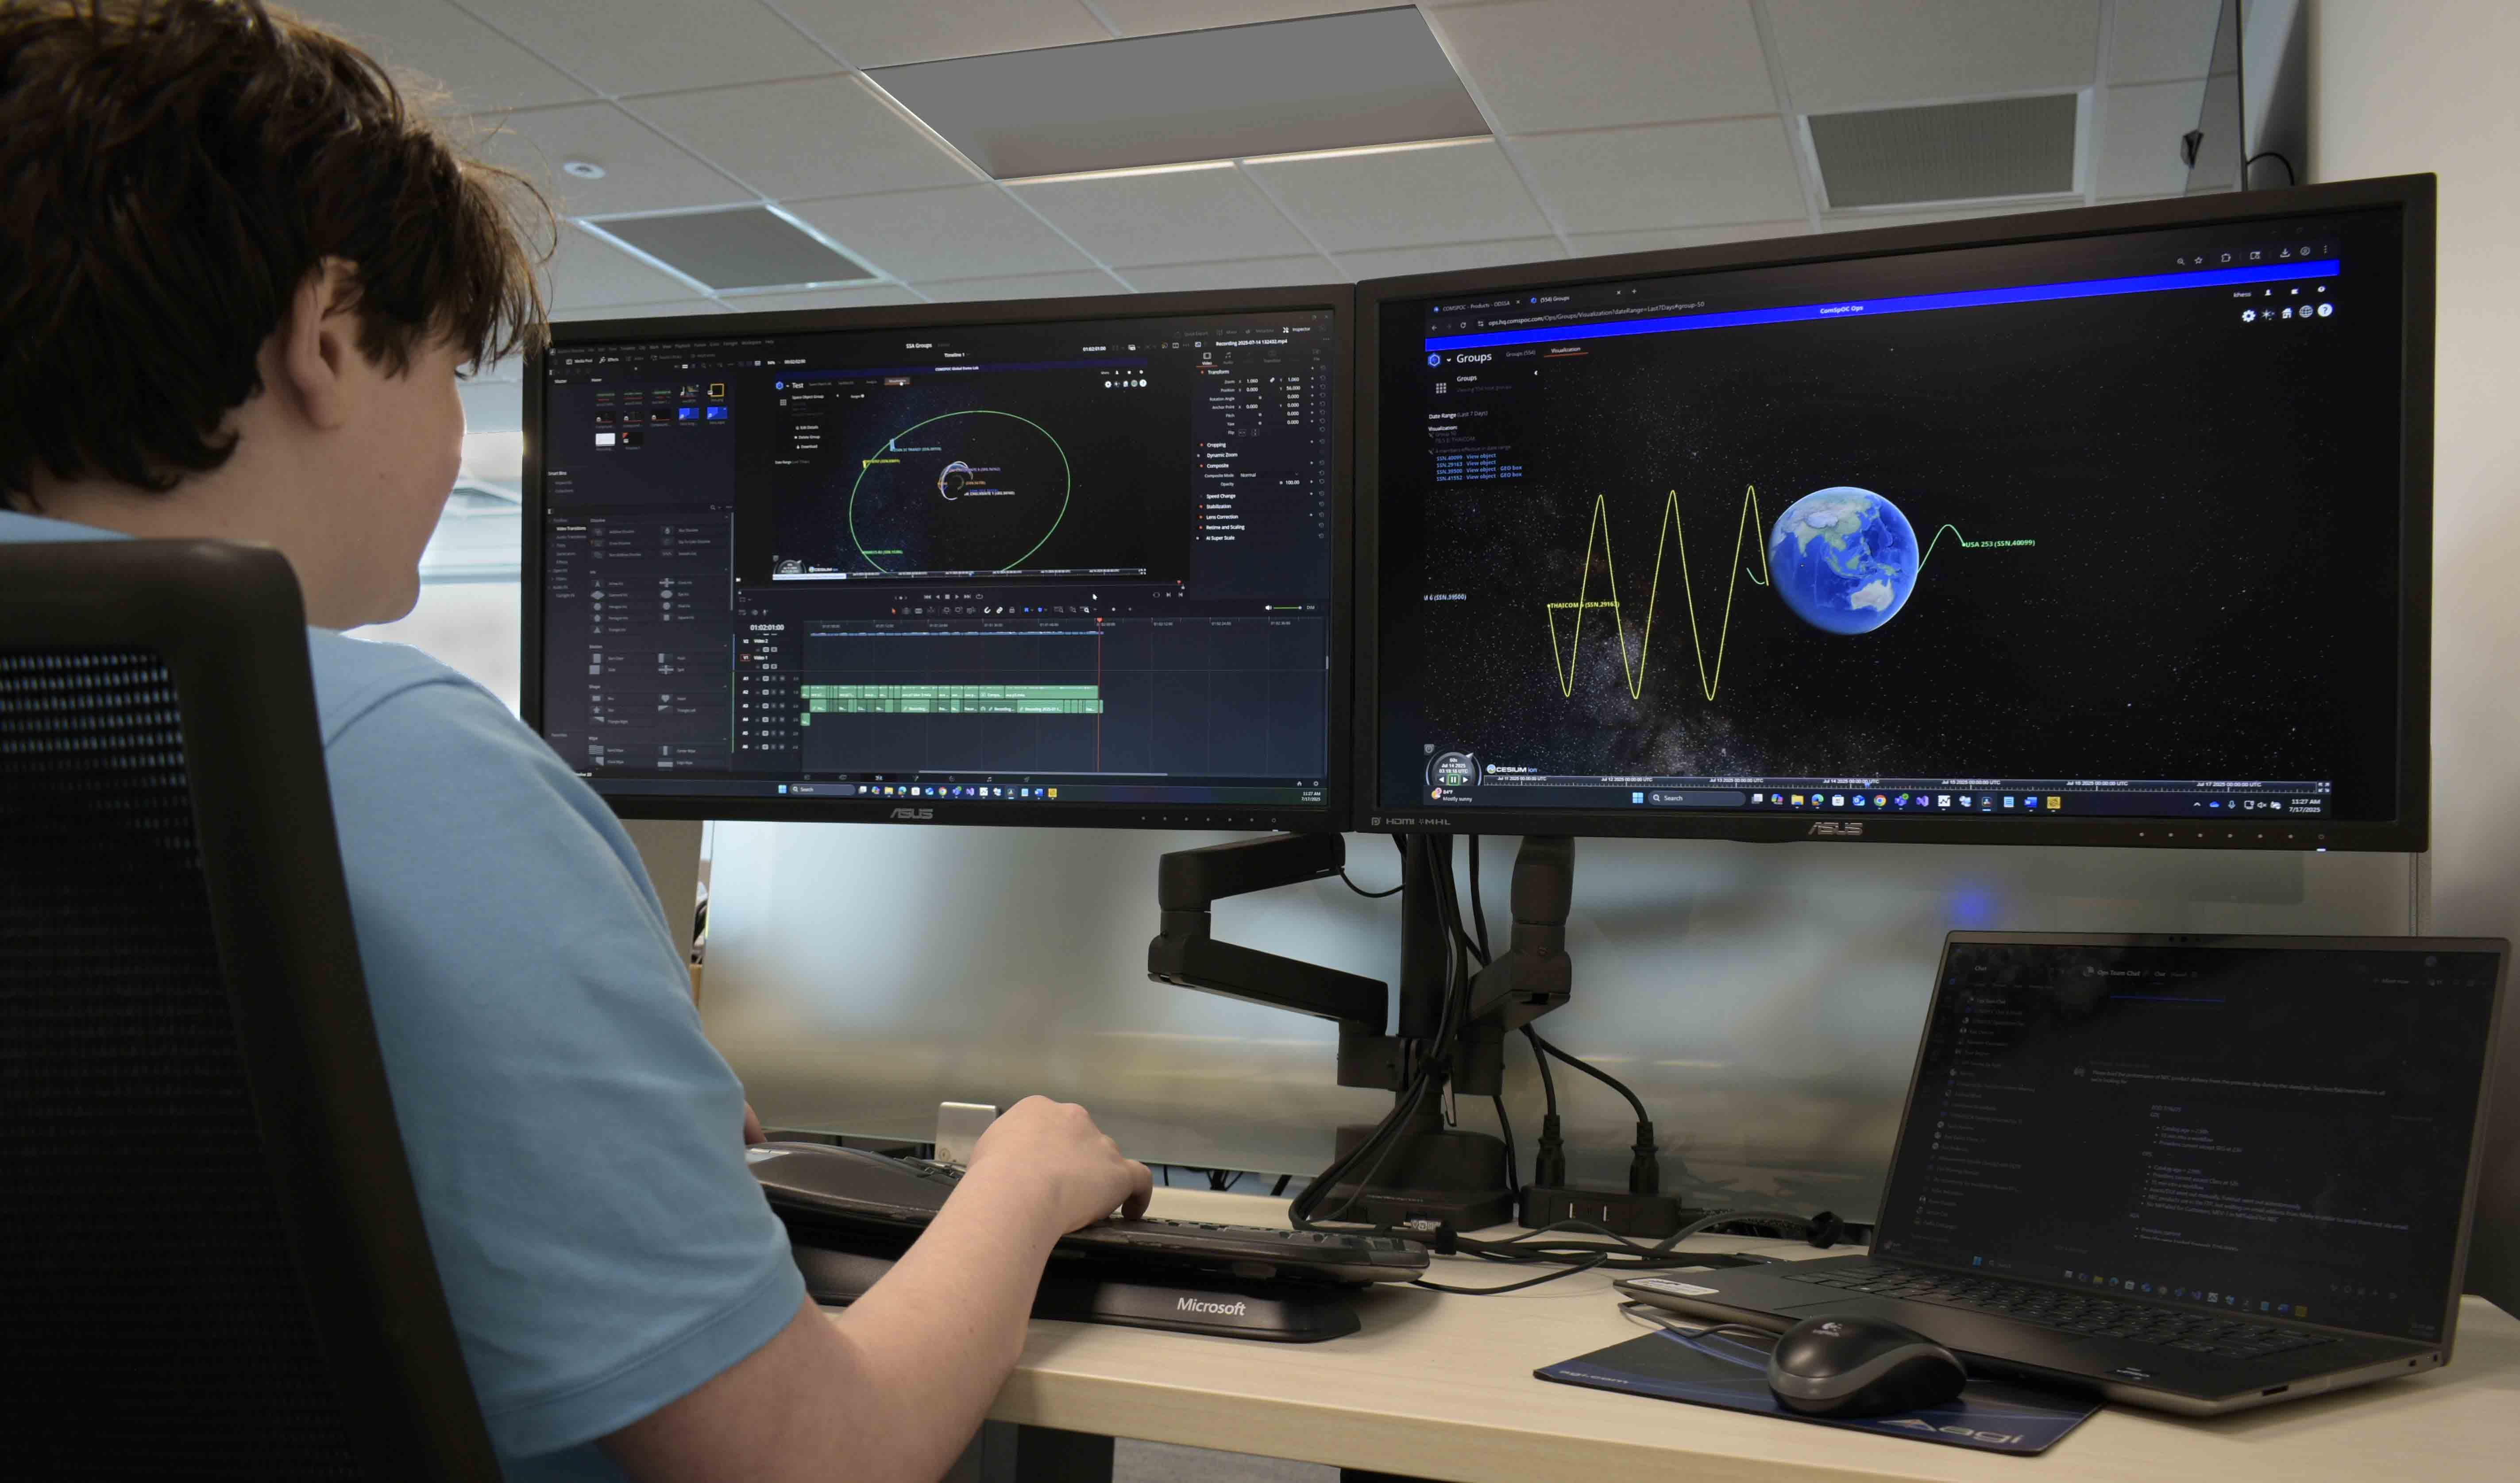
The visualization capabilities of our software are powerful communications tools. A video enables you to explain a space event to a much wider audience and easily call attention to the most important details. And since visualizations from COMSPOC software rely on actual, physics-based data, you can count on the videos you make to portray realistic scenarios.
In the galleries on this page, you can see many examples of how our products can tell the stories that hard data reveals. In addition, this page shares other forms of video content that COMSPOC produces from time to time.
This video shows approximately two weeks of the on-orbit behavior of the Chinese satellite TJS-10 in May 2024. TJS-10 was launched to GEO in November 2023, but the official mission has not been disclosed. Since reaching GEO, TJS-10 has been parked in the vicinity of another Chinese satellite, TJS-3, and in the same plane. Initially TJS-10 was east of TJS-3 by 200-400 km. During May TJS-10 maneuvered to the west of TJS-3, where it has remained, approximately 100 km away. This behavior is very similar to the early operations of TJS-3 with the TJS-3 apogee kick motor (AKM), during the five months of on-orbit testing that followed its launch. Both TJS-3 and TJS-10 are reported to have some sort of communications mission. It was clear from the original TJS-3 on-orbit testing that the AKM was involved. This recent relationship with TJS-10 and TJS-3 implies that TJS-10 may be performing a similar checkout. Note that in the case of TJS-3, the AKM was always to the east of TJS-3. In this recent example, we see TJS-10 operate both east and west of TJS-3.
This animation depicts the 191,000 large constellation spacecraft applied for by the global space community through 2034. This information is mostly based upon FCC and ITU filings; in a few cases, media reports were incorporated as well. Historically, the percentage of applied-for spacecraft that become realized on-orbit is somewhere between 15 to 25%. In the large constellation domain, that number is currently at 10%. Even if only on tenth of these 191,000 applied-for spacecraft are realized, this represents a tripling of our current active spacecraft population. Such an increase will require substantial improvements to our legacy SSA and STC approaches, astrodynamics algorithms, data fusion, and collaboration between spacecraft operators, government and commercial SSA and STC tools and service providers, and regulators.
This video shows a notional trajectory of the X-37B in a highly elliptical orbit (HEO). In this orbit, the lowest point is down near its typical operating range but the furthest point could be out tens of thousands of km, resulting in an orbit that might take 12 hours to go around once.
Viewed slightly from the left side, this topology shows the rate of close encounters to within one kilometer, for publicly cataloged traceable objects, that a new space object would experience if it were inserted into the existing space population at the specified circular orbit altitude and inclination.
Viewed slightly from the right side, this topology shows the rate of close encounters to within one kilometer, for publicly cataloged traceable objects, that a new space object would experience if it were inserted into the existing space population at the specified circular orbit altitude and inclination.
This video shows an animation of how the space population has evolved from the beginning of the space era to present. Initially, due to the sparsity of objects in space, we depict the evolution up to 2005 showing the discrete tracked objects and their count overtime. Then, beginning in 2005, we transition to a spatial density depiction, showing via a color scale how many objects occupy a given 100 by 100 by 100 kilometer voxel in space. From 2005 onward, we also show fragmentation events that have occurred over time, accompanied by a plot of how many space objects exist as a function of time.
This video provides a comparison of what is currently being publicly tracked, versus what we believe exists in space as a function of object size. There are many hundreds of thousands of objects in space today that are large enough to be mission-terminating in the event of a collision, but which we cannot track today.
This video depicts COMSPOC's simulation of Chinese ASAT engagement of Fengyun spacecraft, including discrete fragment breakup and post-fragmentation debris cloud evolution.
This video provides a comparison of Radar and Optical sensor coverage and resulting object size tracked as a function of viewing geometry, illumination, and orbit regime.